The thing that I love most about working at Baffin Bay Networks is the speed at which we can get things done. Nobody says that something is impossible, and we all work towards a common goal: To deliver the best cloud based security platform to mitigate both network and application security attacks. Since we are a startup, we have less internal politics and barriers to build the things our customers want and need. On the other hand, we move so fast that keeping videos and documentation up to date is an ongoing challenge.
In this post, I wanted to give an update on three great things we have added since the webinars linked above;
1. For example, we recently built an integration with Fortinet’s FortiDDoS Appliance to provide a prospect with a hybrid on-prem/Cloud based DDoS solution. The FortiDDoS appliance detects DDoS attacks, and when an attack of considerable size is detected it will signal the portal to take over and mitigate the attack in the cloud. This provides customers who don’t want an ‘always on’ DDoS mitigation with more flexibility in their deployment, as well as automated responses to ongoing attacks. The most interesting thing about this, from my perspective is that this integration went from concept to production in just under 10 days, including dev., testing, QA and verification. I’d like to thank the team at Fortinet for their support in getting this feature implemented, they have been fantastic to work with. This feature is currently in selected customer beta today.
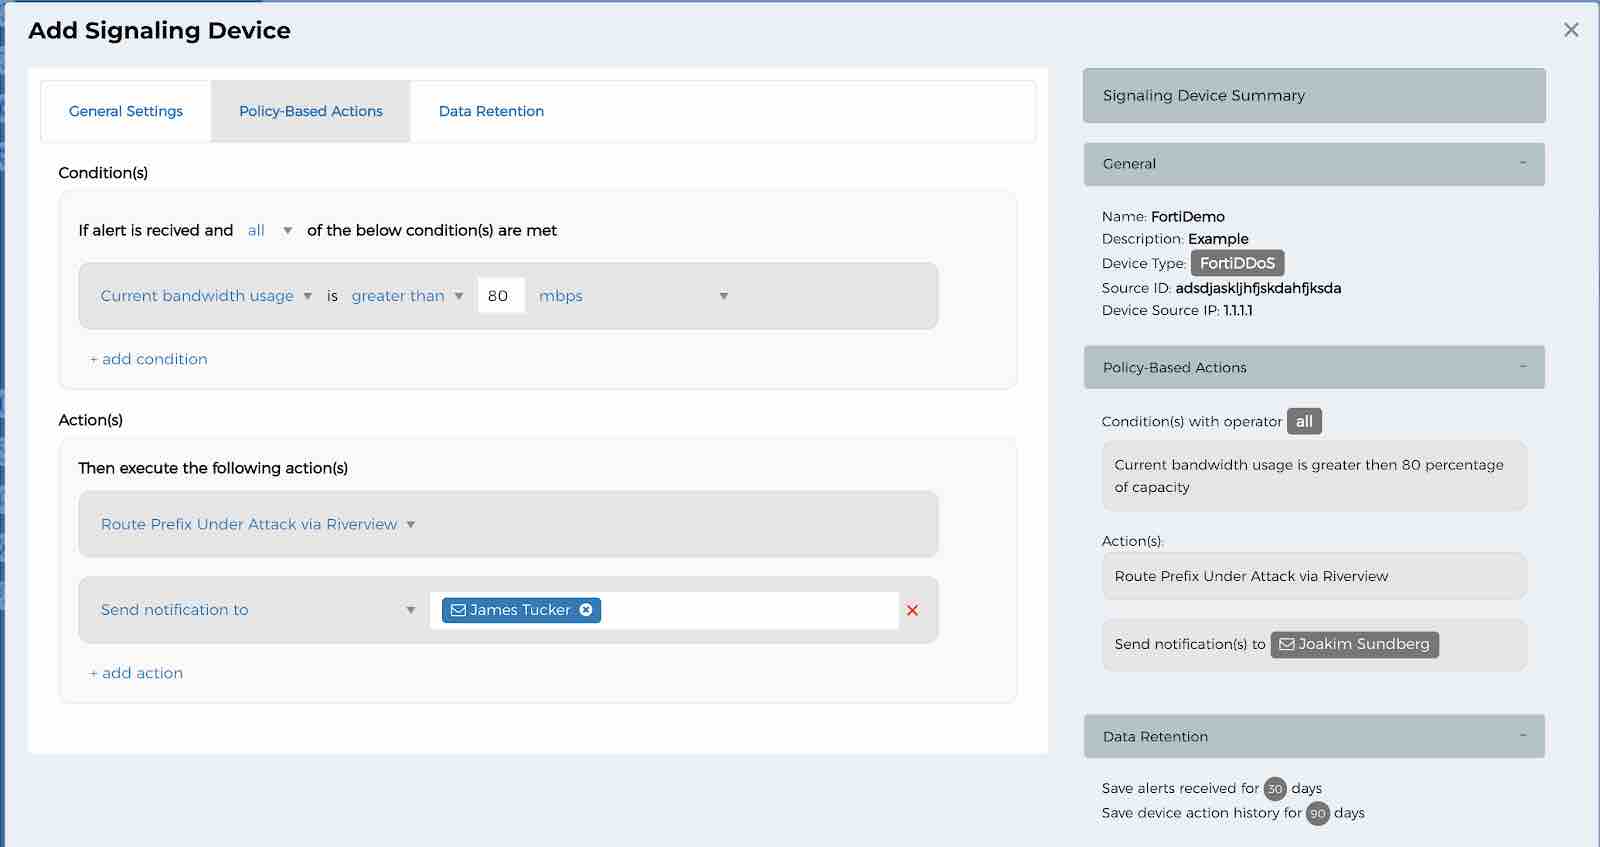 2. Another new feature is something we call ‘Route Monitoring’. With Route Monitoring, your on-prem routers, switches, or firewalls can send either IPv4 or IPv6 flow data (netflow, sFlow, IPFIX) into the portal. This data is processed by an analytics engine to learn your traffic profiles and can be used for both visibility as well as detection of denial of service attacks. Again, when the portal detects anomalous traffic, we can automatically start mitigating. The setup is similar to the FortiDDoS screen shown above. This feature is currently in beta for selected customers.
3. The last major feature I’d like to highlight is the new Dashboard. This has been a key focus the past few weeks, and the progress has been great. While there is still lots of work to do before it’s done (is a software project ever really done?), I wanted to show the kind of visibility we are providing to our customers. Here’s a screenshot from the dashboard showing ‘Clean’ vs ‘Dirty’ Traffic. The stacked graph shows the proportion of clean traffic (in blue) vs the dirty traffic (red). Note the ‘Dashboard Type’ selection in the left menu, there’s more to come.
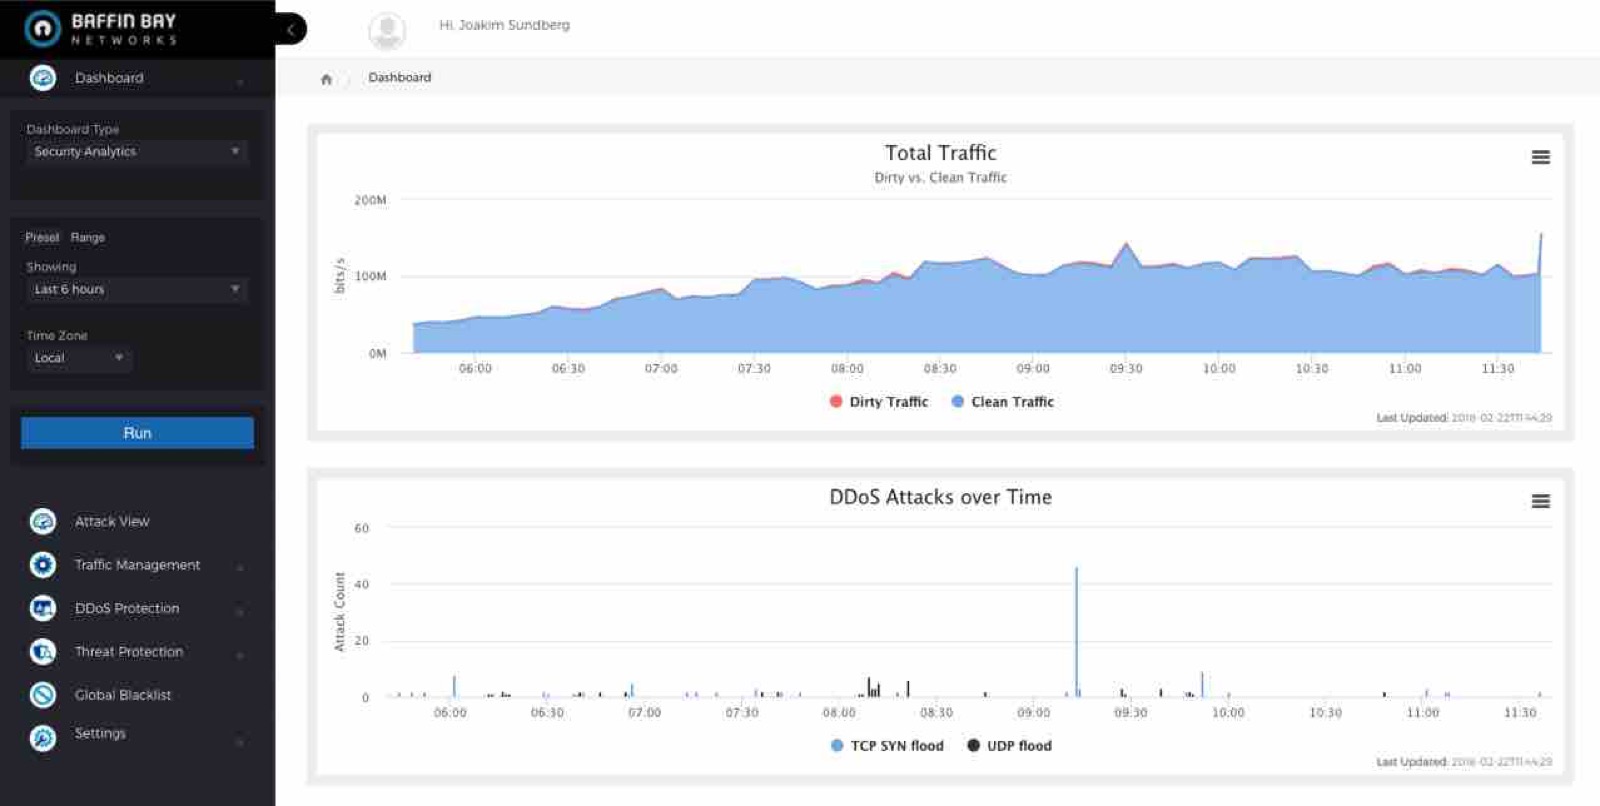 In addition to the graph above, the Dashboard also gives insight into the malicious traffic we are mitigating in our Threat Prevention Centers. Here you can see the various types of DDoS attacks seen over a 6 hour period, as well as known-bad IP addresses blocked with our Threat Intelligence feature.
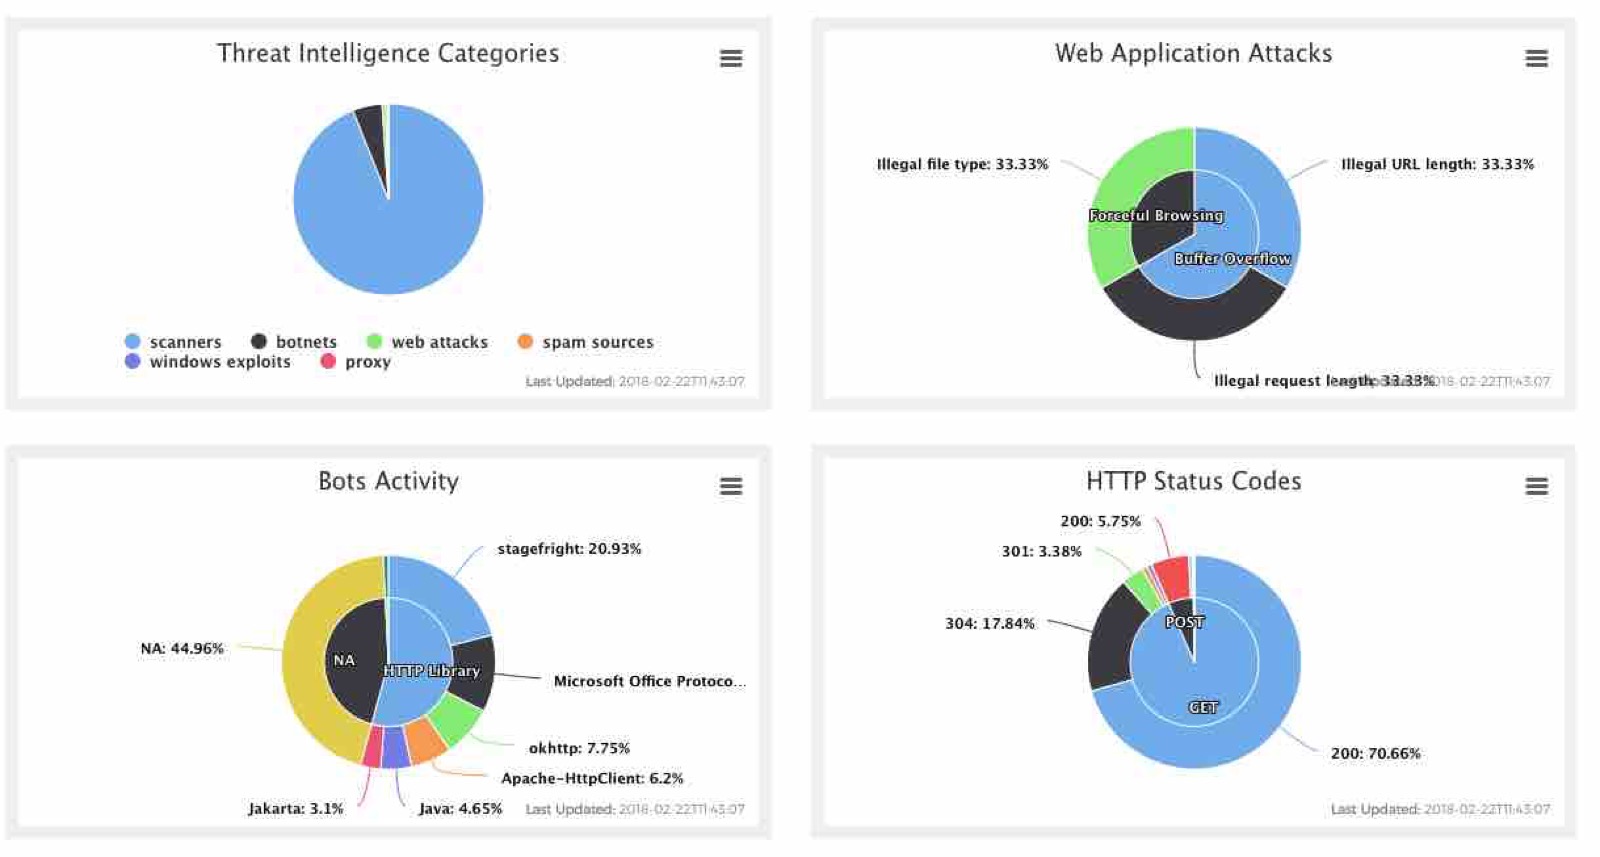
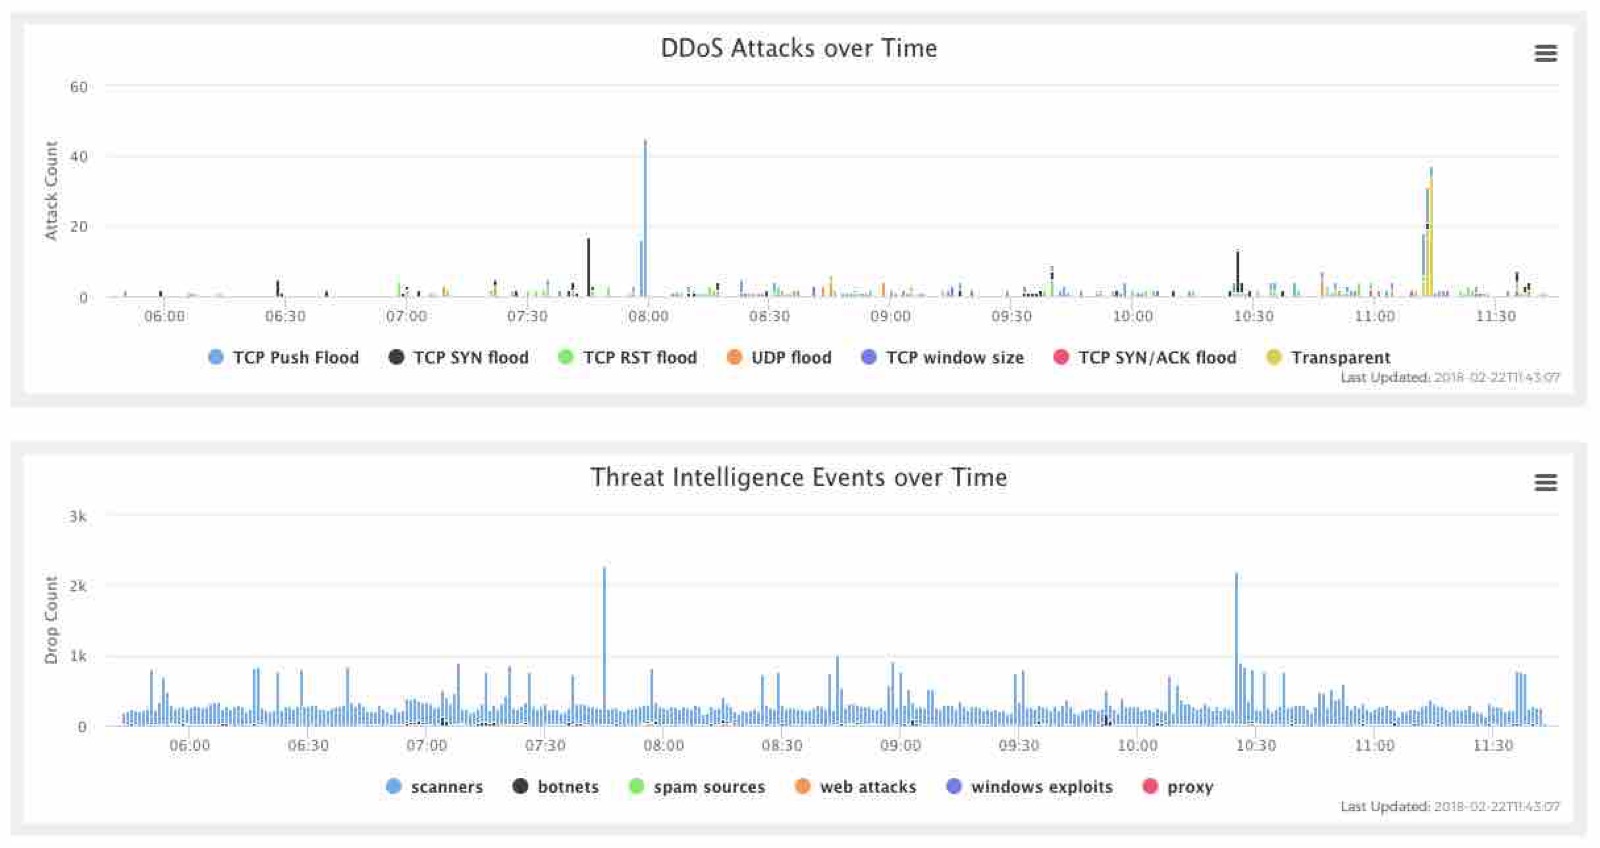 I particularly like the concept of being able to tie certain attack/usage profiles to times of day, which allows our customers to do better threat modeling. Looking at the graphs below, you can also see which categories the Threat Intel events fall into, lots of scanners and botnets in this data set. Botnets are also broken down into appropriate categories.
 As I said earlier, a software project is never done. We are currently working on additional widgets for this dashboard, as well as a few additional dashboard types. We do this hand in hand with our customers; We are building this for them.
Of course, this is just a selection of the new features we’ve been working on, there’s a lot more nuts and bolts stuff getting done, but nobody would read a blog post about RBAC, would they?